Restaurant Analytics Dashboard
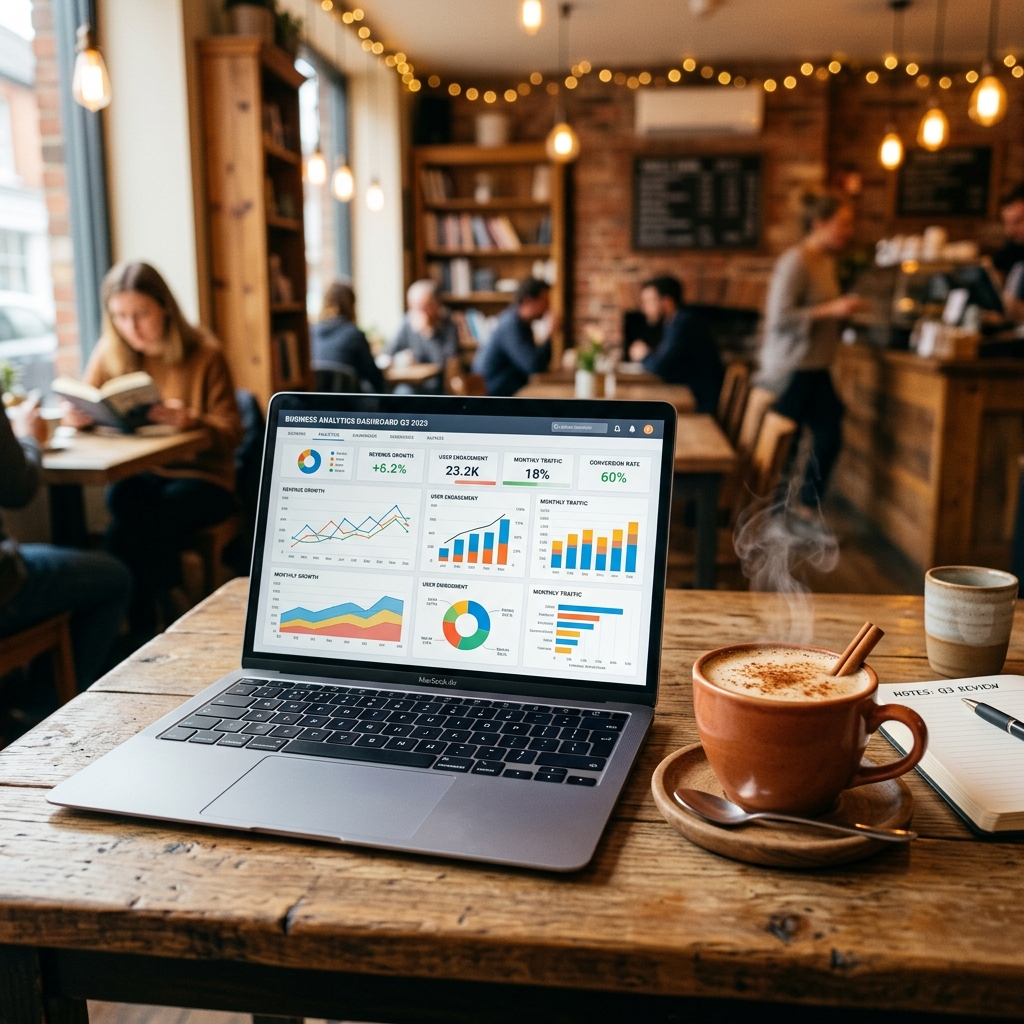
A restaurant analytics dashboard tracks key business performance metrics in real-time — including daily sales, popular menu items, peak ordering hours, table turnover rates, and waiter efficiency.
What Metrics Can You Track?
RestaurantOS turns daily transaction data into structured, easy-to-read charts and reports. Owners can access these insights from any smartphone, tablet, or PC:
Monitor daily, weekly, and monthly revenue with clear trend lines to identify sales growth patterns.
See which items are ordered most frequently, which generate the most revenue, and which items are ignored.
Track sales volume by hour to optimize kitchen preparation and staff scheduling during busy lunch or dinner rushes.
Analyze average session durations from QR scan to checkout to improve dining room capacity and service speed.
Aggregate reviews and ratings submitted by customers directly after checking out to monitor service quality.
Why Your Restaurant Needs Data-Driven Insights
Optimize Menu Engineering
Identify low-margin dishes or items that don't sell. Replace them or adjust prices to maximize menu profitability.
Reduce Food Waste
Predict busy days and peak hours based on historical trends to order fresh ingredients accurately and reduce prep waste.
Monitor Service Standards
Identify service bottlenecks by tracking average KOT preparation times and customer satisfaction reviews per table.
Make Informed Decisions
No more guesswork. Know exactly when your business peaks, what your customers love, and how your revenue scales.
Last updated: July 2026